Overview
Effective monitoring is key to ensuring the reliability and timeliness of your data processing tasks.
Empower provides robust tools for monitoring your data estate, enabling you to track their execution status, performance, and any issues that may arise. From , we detail how users can leverage the task log page in Empower to monitor their data flows, focusing on aspects such as start times, run IDs, durations, and statuses.
Run Logs
Empower provides logging capabilities to track the various current and historical runs of any data task.
Navigate to a specific Task's logs by clicking on it's name in the Task table then selecting the "Runs" tab.
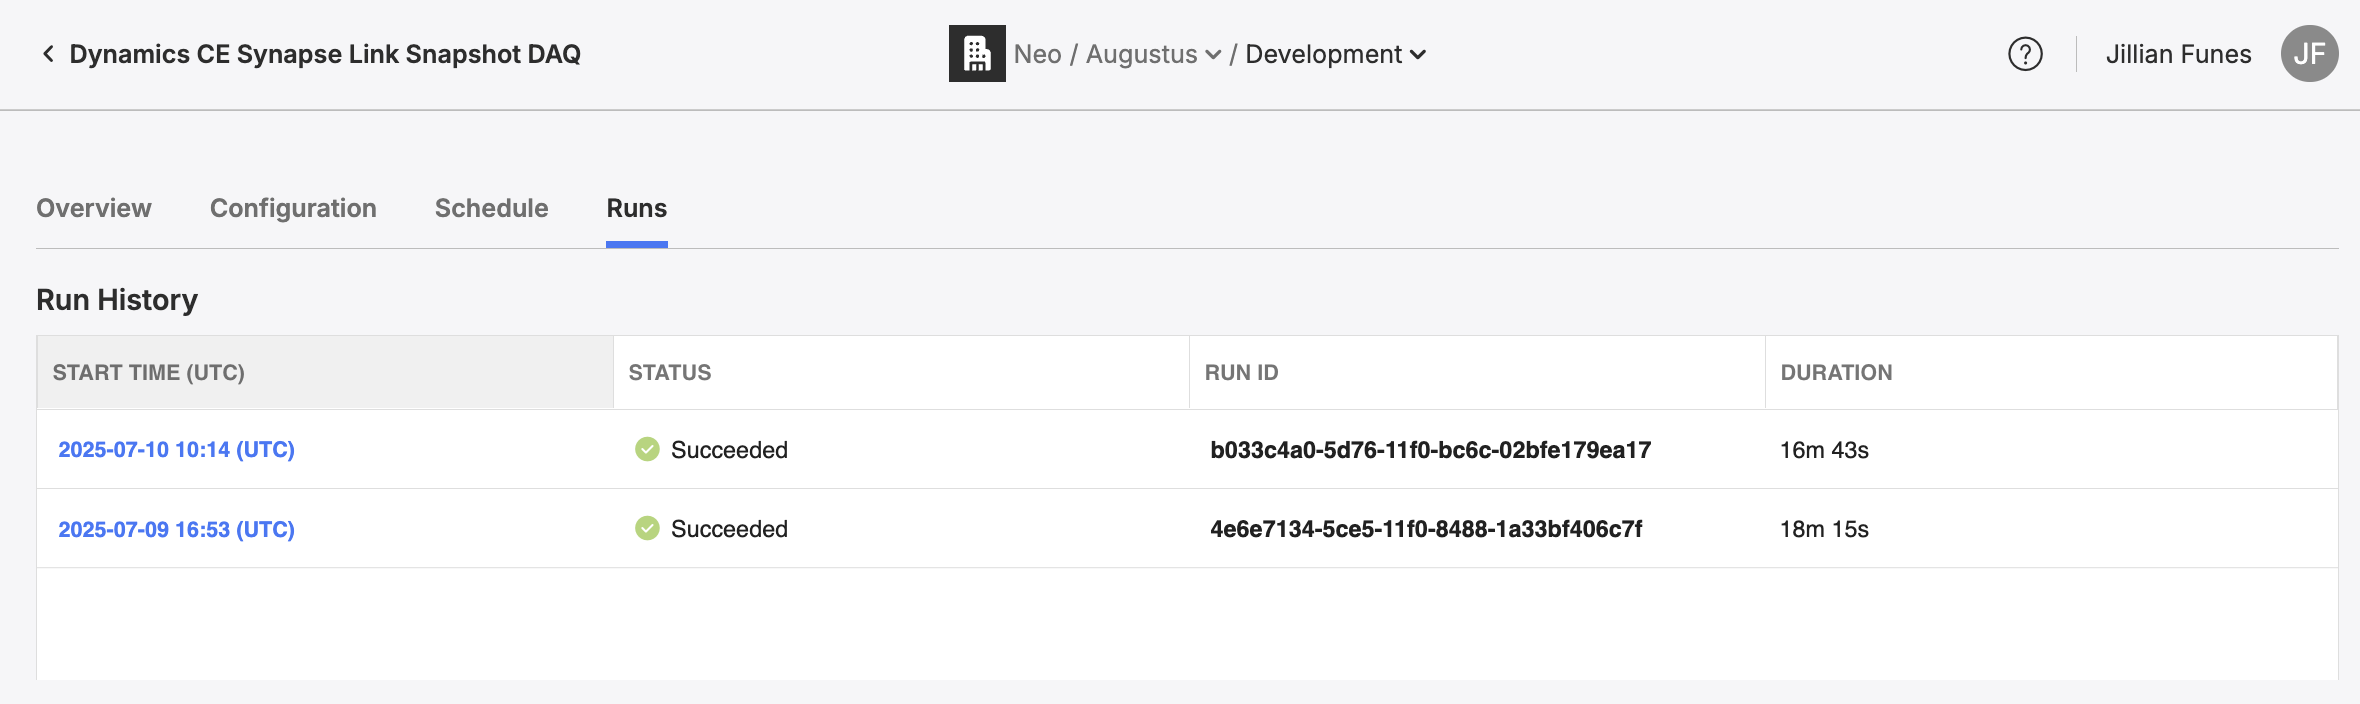
Run ID: Upon initialization a run is assigned a unique Run ID. This identifier is crucial for tracking specific instances of runs programmatically, especially when diagnosing issues or auditing data processing tasks.
Start Times: This indicates when the run execution began. Tracking start times helps in understanding the schedule adherence and identifying any delays in execution.
Duration: Duration tracks the length of time a run took to complete. Significant deviations from the norm can indicate problems or inefficiencies in data acquisition, processing, or publishing.
Status: Status (e.g., “Success,” “Failed,” “Running”) provides immediate insight into a run's current or completed state.
Run Details
To see additional detail about a specific run, you can click on a specific row in the run log table.
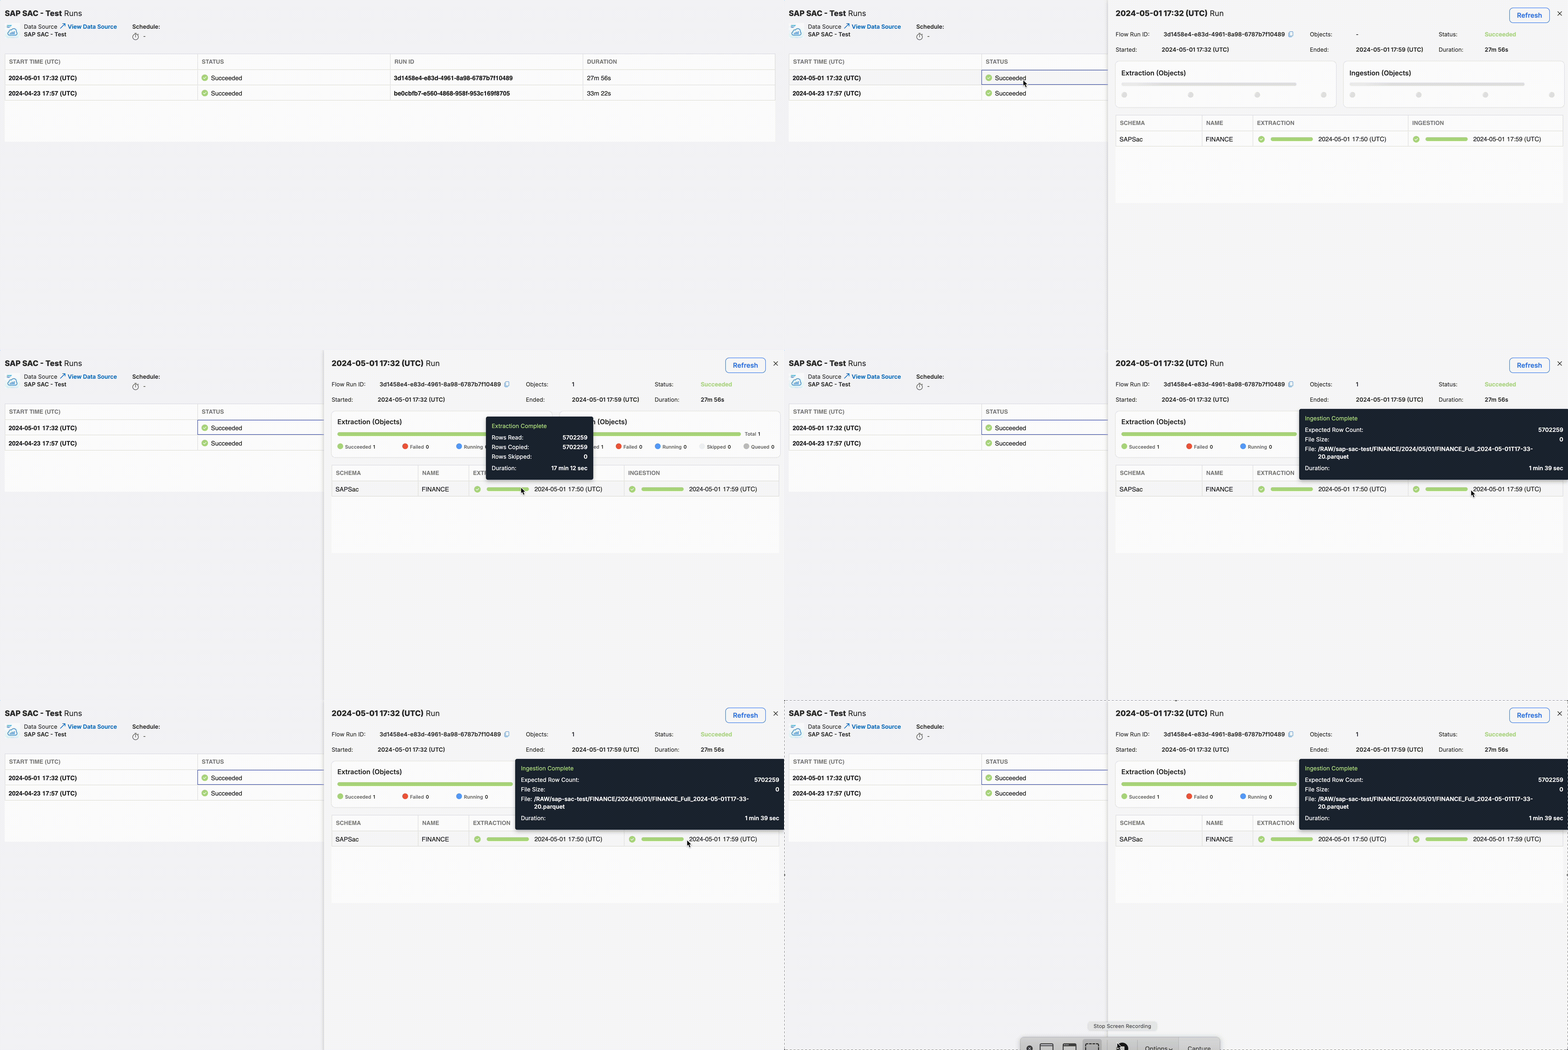 Click on a Run Log row to view more details.
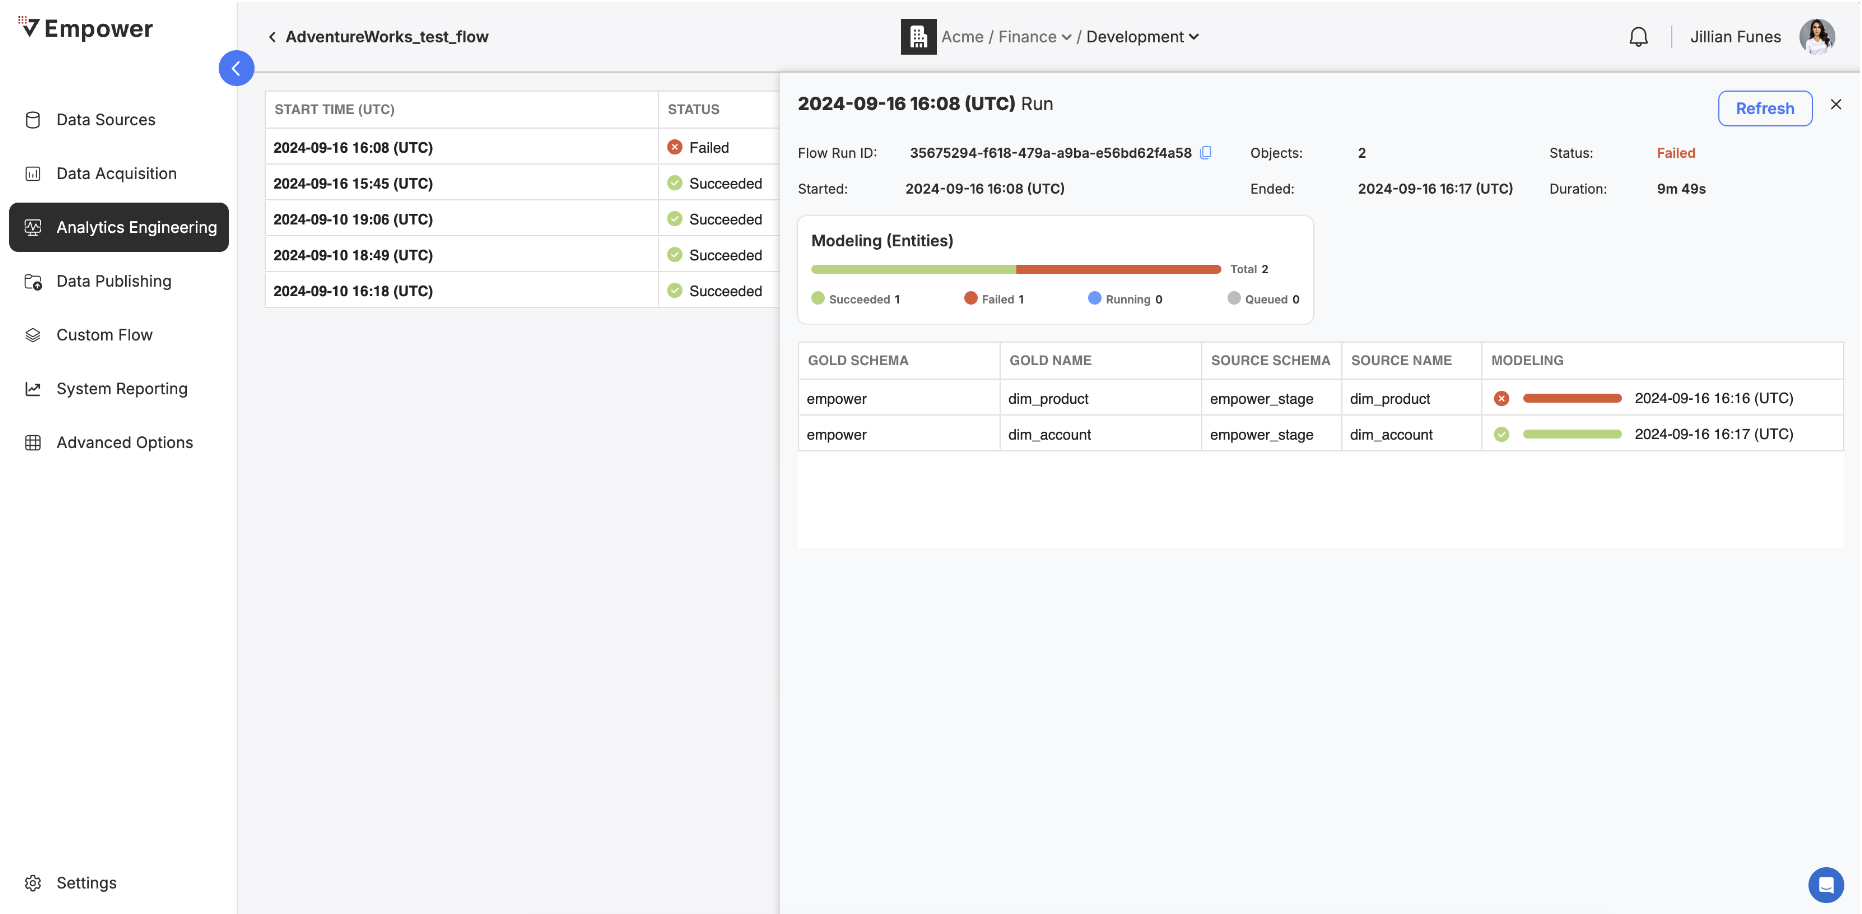
The run detail view provides you with an object-by-object (or entity-by-entity depending on the data task type) view of everything that happened during that run.
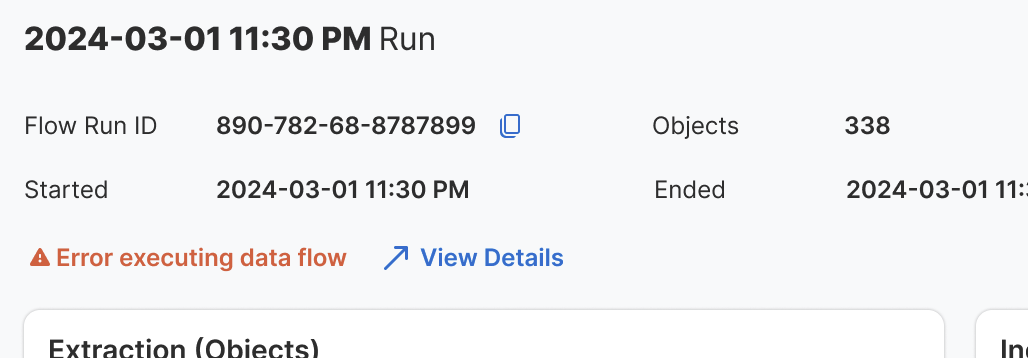
At the top of details, you can find the following information about the run:
- Task Run ID: The ADF run ID. This ID is useful to be able to copy and send if you need help from your delivery manager.
- Objects/Entities: The number of objects or entities processed in that run.
- Status: Whether the overall run succeeded, failed, is still running, or is queue to run.
- Started: The date and time at which the run started.
- Ended: The date and time at which the run ended.
- Duration: The amount of time elapsed between the start and end times.
Note that the details shown in the table of this view will vary based on the data task type. See the data task type sections below for more detail on what information is shown for each type.
In the case of a failed run, you can drill in to see the exact error that caused the failure by clicking on row of the object that failed.
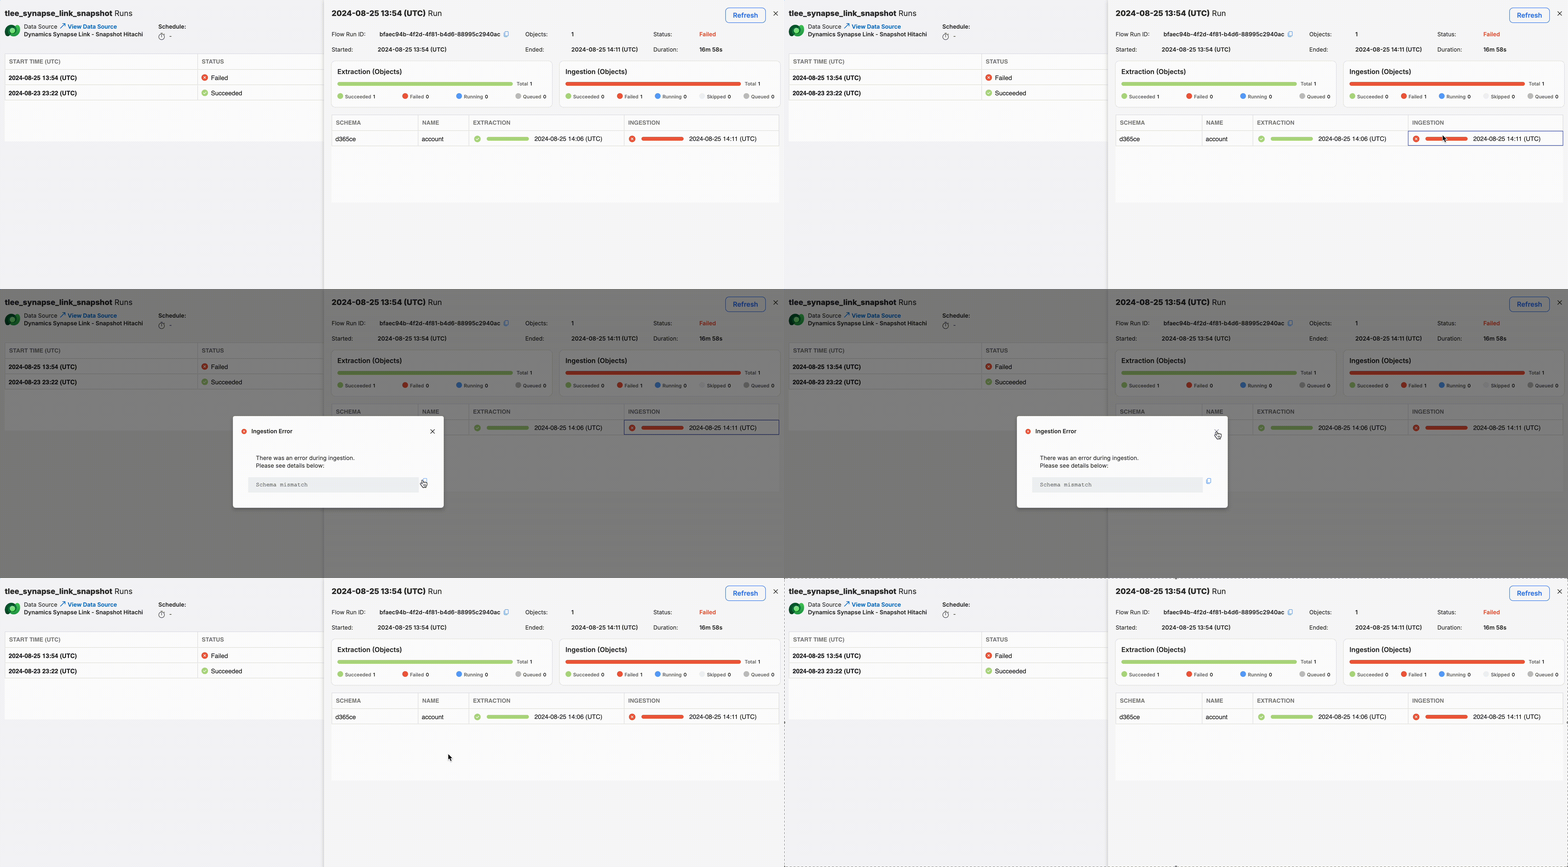 Click on a failed object run to view error details.
Underneath stack trace information, two links will be visible.
 Separate status bars and columns for Extraction and Ingestion steps.
The Acquisition run details table provides the following additional details:
- Object schema: The schema associated with the source object.
- Object name: The name of the object.
- Status and end time of the extraction step for that object
- Status and end time of the ingestion step for that object
Hovering over the status bar in the Extraction column will provide more details on the number of rows processed for that object and the duration it took to complete.
Similarly for Ingestion, hovering will provide additional details on the duration to complete, rows ingested, and file path.
You may also find a general error message located above the progress bars. This error message will be shown in the case that there is a need to surface errors that affect the entire data task rather than specific objects or entities. This is particularly useful in scenarios where a data acquisition task fails due to issues that prevent the ingestion process from starting, such as a preceding ingestion failure.
Transformation Run Details
In addition to the basic run details provided in every view, the Transformation details pane provided specific information regarding the status of each entity that was processed as part of that run:
- Gold Schema: The schema name of where the resulting data will be pushed to in your gold layer.
- Gold Name: The entity name of where the resulting data will be pushed to in your gold layer.
- Source Schema: The schema name of where the data was pulled from.
- Source Name: The entity name of where the data was pulled from.
Publishing Run Details
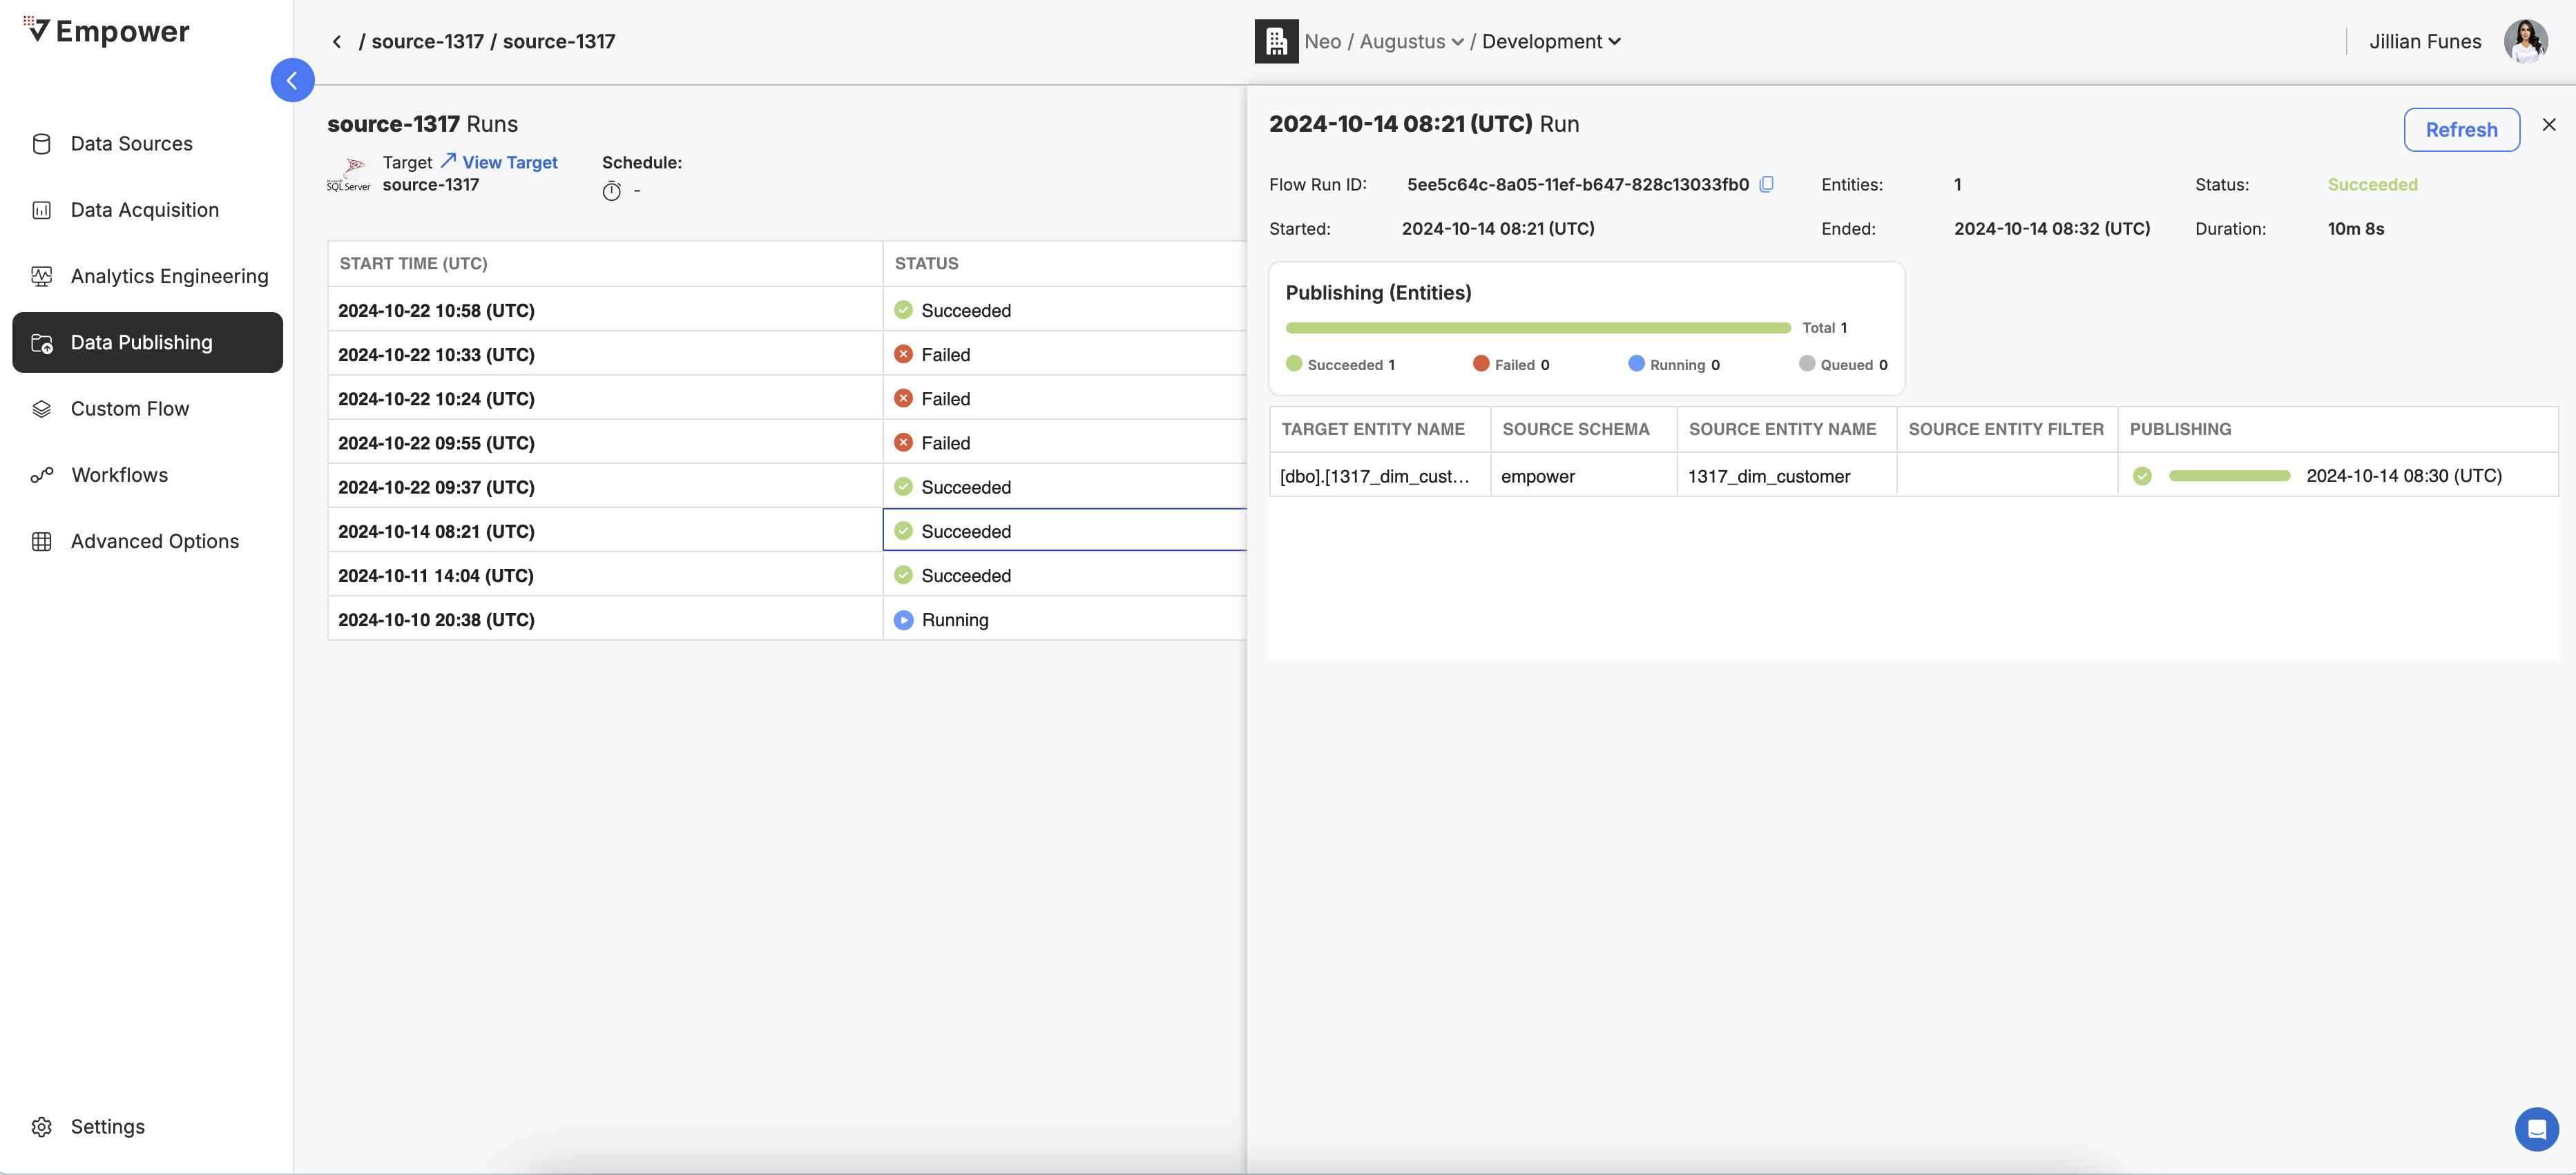
In addition to the basic run details provided in every view, the Analytics Engineering details pane provided specific information regarding the status of each entity that was processed as part of that run:
- Target Entity Name: The name of the entity in the source location.
- Source Schema: The schema of where the entity was published from.
- Source Entity Name: The entity name as it was in the source.
- Source Entity Filter: An optional WHERE SQL condition parameter if one was specified.
- Publishing: The current status and completion time for that entity.